Chart patterns
Chart patterns are vital tools for traders, providing insights into potential price movements in financial markets. By recognizing these patterns, traders can make informed decisions about entering or exiting trades. This article delves into the world of chart patterns, exploring their types, significance, and practical applications in trading strategies.
What Are Chart Patterns?
Chart patterns are formations created by the movement of price data over time on a chart. They can be visualized using various types of charts, including line charts, bar charts, and candlestick charts. These patterns reflect the underlying market psychology, highlighting the balance of supply and demand. When traders observe these formations, they often predict future price movements based on historical behaviors.
The Importance of Chart Patterns in Trading
Understanding chart patterns is essential for several reasons:
Market Psychology: Chart patterns reveal the collective sentiment of market participants. For example, a bullish pattern indicates that buyers are in control, while a bearish pattern suggests that sellers dominate.
Trend Identification: Traders can use chart patterns to identify current trends and potential reversals. Recognizing these trends early can lead to profitable trading opportunities.
Risk Management: By identifying key support and resistance levels within patterns, traders can set stop-loss orders more effectively, thus managing their risk.
Enhanced Decision-Making: Chart patterns provide traders with a visual representation of price movements, allowing for more strategic decision-making.
Types of Chart Patterns
Chart patterns are generally categorized into two main types: continuation patterns and reversal patterns.
Continuation Patterns
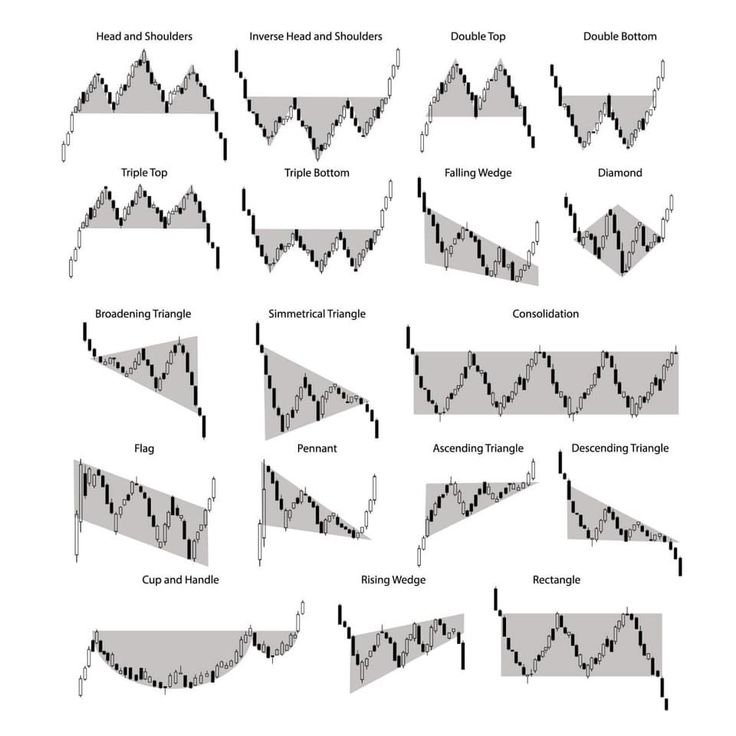
Continuation patterns indicate that the current trend is likely to continue after a brief period of consolidation. Here are some common continuation patterns:
Flags and Pennants
Flags and pennants are short-term continuation patterns that occur after a strong price movement.
- Flags: These are rectangular-shaped formations that slope against the prevailing trend. Flags typically last from a few days to a few weeks and signify a brief consolidation before the trend resumes.
- Pennants: Similar to flags, pennants are formed after a strong price movement but take on a triangular shape. They indicate that the market is consolidating before a breakout in the direction of the prior trend.
Triangles
Triangles are formed when the price consolidates, resulting in converging trendlines. They can be ascending, descending, or symmetrical:
- Ascending Triangles: Characterized by a flat upper trendline and an upward-sloping lower trendline, indicating bullish sentiment.
- Descending Triangles: Feature a flat lower trendline and a downward-sloping upper trendline, suggesting bearish sentiment.
- Symmetrical Triangles: Both trendlines converge, and the breakout direction can be either bullish or bearish, making it less predictable.
Reversal Patterns
Reversal patterns signal a potential change in trend direction. Here are some well-known reversal patterns:
Head and Shoulders
The head and shoulders pattern indicates a trend reversal. It consists of three peaks: a higher peak (head) between two lower peaks (shoulders).
- Regular Head and Shoulders: Signals a reversal from bullish to bearish. The breakout occurs below the neckline, a support line drawn through the lowest points of the two shoulders.
- Inverse Head and Shoulders: Suggests a reversal from bearish to bullish. The breakout occurs above the neckline.
Double Tops and Bottoms
Double tops and bottoms are reversal patterns that indicate a shift in trend direction.
- Double Top: Formed after an uptrend, it consists of two peaks at roughly the same price level. A breakout below the support level confirms the reversal to a downtrend.
- Double Bottom: Appears after a downtrend, characterized by two troughs at a similar price level. A breakout above the resistance level indicates a reversal to an uptrend.
Rounding Bottom
The rounding bottom pattern, also known as a saucer bottom, indicates a gradual shift from a bearish to a bullish trend. It is characterized by a smooth, U-shaped formation, suggesting a slow but steady accumulation of buying pressure.
How to Trade Chart Patterns
Trading chart patterns effectively requires a systematic approach. Here are steps to consider:
Identify the Pattern
Use technical analysis to identify the formation of chart patterns on your chosen timeframe. Ensure that the pattern is clearly defined and meets the characteristics of the pattern you are observing.
Confirm the Breakout
Wait for a breakout beyond the pattern’s boundaries (e.g., above the resistance level for bullish patterns or below the support level for bearish patterns). Volume should ideally increase during the breakout, confirming the strength of the move.
Set Entry and Exit Points
Once the breakout is confirmed, set your entry point slightly above the breakout level for bullish patterns or below for bearish patterns. Establish stop-loss orders to manage risk effectively.
Take Profit Targets
Determine your profit targets based on the pattern’s height. For instance, in a head and shoulders pattern, the distance from the head to the neckline can help estimate the potential price target after the breakout.
Monitor and Adjust
Continuously monitor the trade, adjusting your stop-loss and profit targets as necessary based on market conditions.
Common Mistakes to Avoid
While trading chart patterns can be profitable, traders should be cautious of common pitfalls:
- Ignoring Volume: Volume is a critical confirmation tool. A breakout on low volume may indicate a false move.
- Overtrading: Not every chart pattern results in a profitable trade. Avoid the temptation to trade every pattern; focus on high-probability setups.
- Neglecting Market Context: Always consider broader market trends and economic factors that may influence price movements.
Conclusion
Chart patterns are invaluable tools for traders, offering insights into market behavior and potential future price movements. By mastering these patterns and integrating them into a comprehensive trading strategy, traders can enhance their decision-making and improve their chances of success in the financial markets. Remember, practice is key—spend time analyzing patterns in historical price data to build your skills and confidence as a trader.